
On Rupeezy, tap an MCX commodity contract from search or your Watchlist to open its contract detail screen: live price, expiry, a price chart, PCR/Open Interest by strike, market depth, and the Future Chain.
How do I open a commodity contract's detail screen?
1. Search for the commodity, like CRUDEOIL or GOLD. See How do I add MCX F&O contracts to my Watchlist? for the full search flow — each expiry and strike is its own row, tagged MCX FO.
2. Tap the contract row.
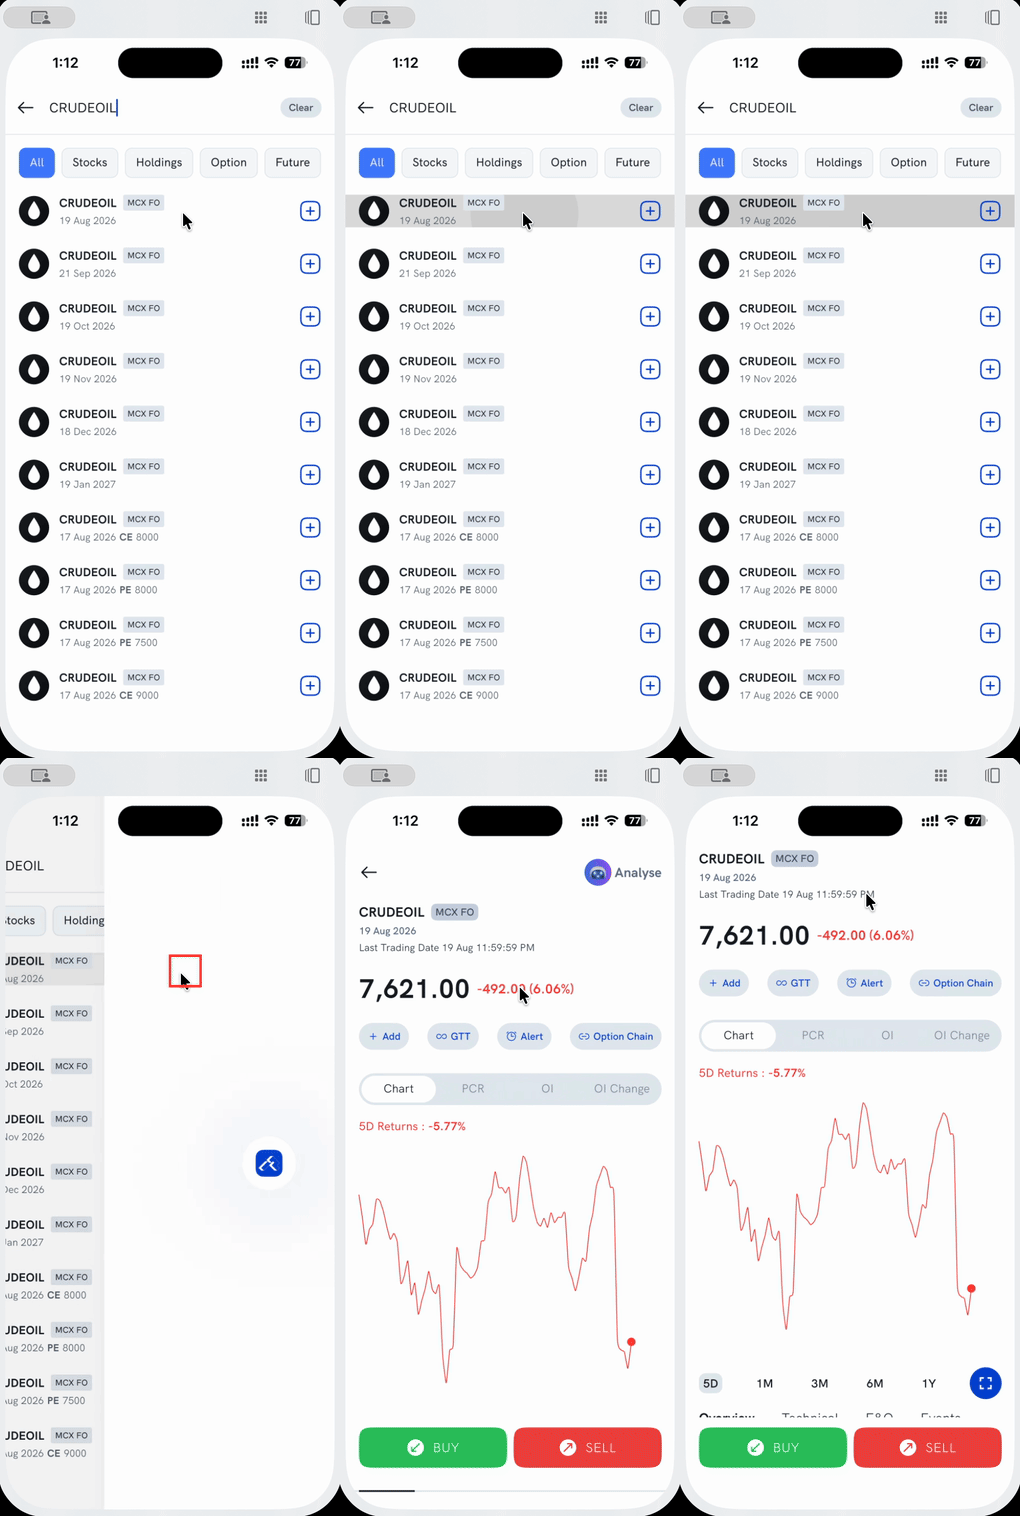
3. The detail screen opens for that exact contract — its name and expiry, live price, action buttons, and a Chart / PCR / OI / OI Change tab row.
What's at the top of the contract detail screen?
- Contract name and expiry — e.g. CRUDEOIL MCX FO, 19 Aug 2026, with the Last Trading Date just below it.
- LTP and change — the last traded price, with the change in rupees and percentage.
- Action row — + Add (Watchlist), GTT, Alert, and Option Chain. See How do I place a GTT order on the Rupeezy app?, How do I set price alerts?, and How do I view the Option Chain on Rupeezy?.
- BUY / SELL — fixed at the bottom of the screen throughout.
What does the Chart tab show?
A price chart for the contract with 5D / 1M / 3M / 6M / 1Y range buttons and a 5D Returns figure above it. Holding a finger (or, on a mouse-driven capture, dragging the pointer) along the line reads off the price at that point in time.
Scroll down and the same screen carries an Overview tab with the contract's day and range figures:
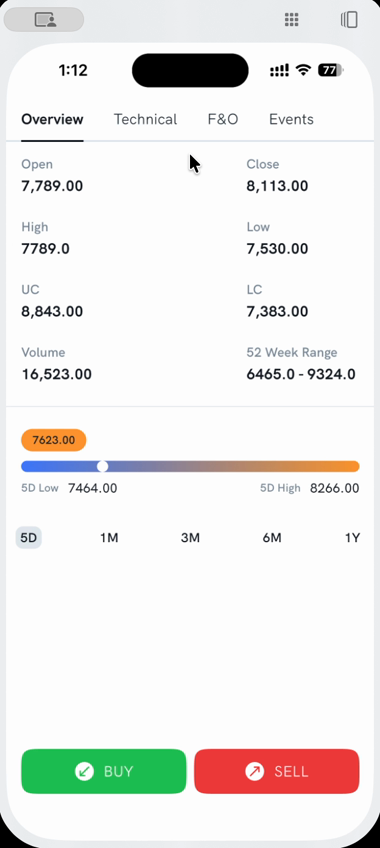
- Open / Close / High / Low for the day
- UC / LC — the upper and lower circuit limits for the contract
- Volume and the 52 Week Range
What does the Technical tab show?
Technical → Market Depth shows the same best-5 buy/sell levels, Total Qty, and Buy/Sell Orders % split as on a stock — see What is market depth and how do I view it? for what each field means:
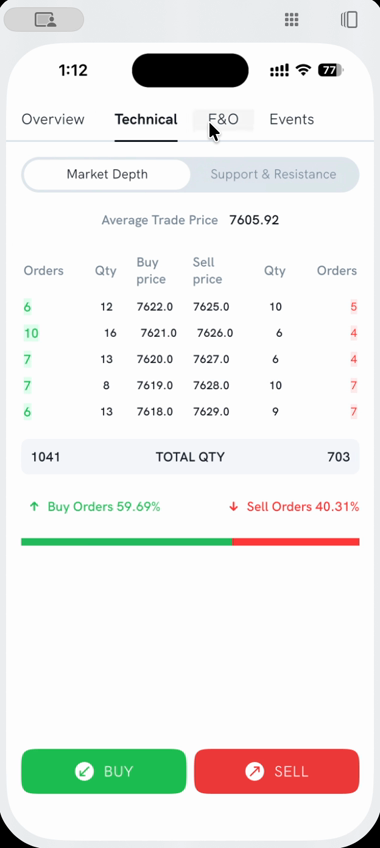
A second sub-tab, Support & Resistance, sits next to Market Depth.
What does the F&O tab show?
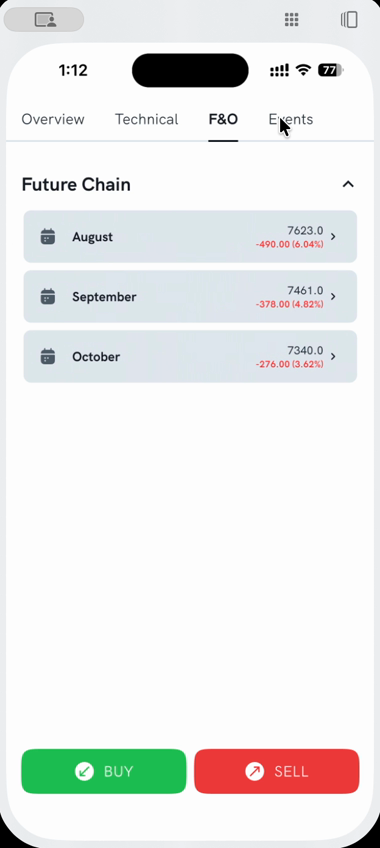
F&O → Future Chain lists the contract's other upcoming expiries (for example August, September, October) with each month's LTP and change, so you can compare or switch expiries without searching again:
What do the PCR, OI, and OI Change tabs show?
Next to Chart at the top of the screen, three more tabs chart the underlying's option data by strike price — PCR (Put-Call Ratio), OI (Open Interest), and OI Change, each as a bar chart against Strike Price on the x-axis:
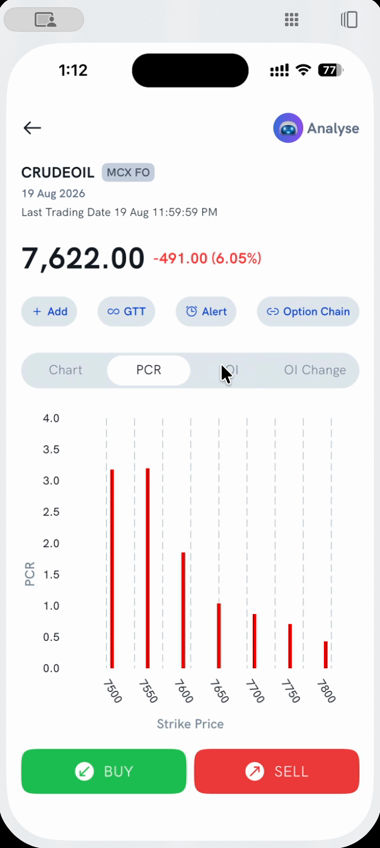
OI and OI Change use the same layout, plotting open interest and its change instead of PCR.
Things to keep in mind
- Tap the row, not the +. The + only adds the contract to your Watchlist — it doesn't open this screen or place an order.
- PCR, OI, and Market Depth update through the trading session — the values you see will differ from what's shown here.
- Each expiry and strike is a separate contract. Switching expiry from the Future Chain opens that month's own detail screen, with its own price, OI, and depth.
- You need the commodity (MCX) segment activated to trade a contract, though you can view its detail screen either way.