
Market depth shows the best 5 buy and sell prices for a stock, along with the quantity and number of orders at each price, so you can see demand and supply before you place an order.
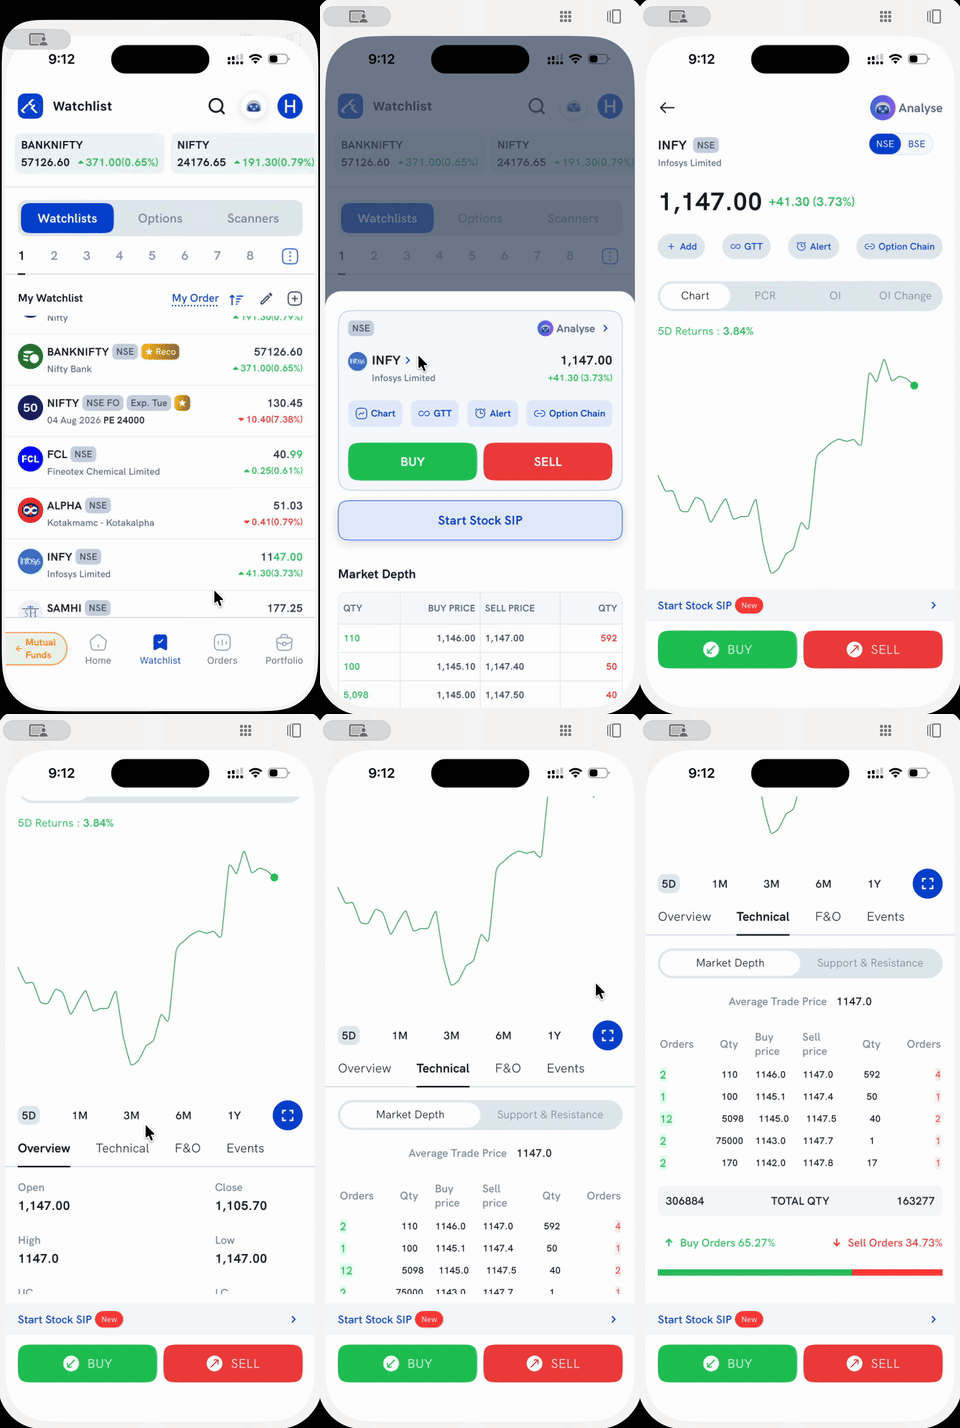
What does the market depth screen show?
| Field | What it shows |
|---|---|
| Average Trade Price | Shown at the top of the screen |
| Depth table | The best 5 price levels: Orders, Qty, Buy price on the left; Sell price, Qty, Orders on the right |
| Total Qty | The total buy quantity and total sell quantity across all 5 levels |
| Buy Orders % / Sell Orders % | The split between pending buy and sell orders, shown as a proportion bar |
How do I view market depth on the Rupeezy app?
1. Open the stock. Tap it from your Watchlist to open its quick-view sheet.
2. Open the full stock detail screen. Tap the stock's name to expand it.
3. Go to the Technical tab, then Market Depth. It's the default sub-tab, next to Support & Resistance.
For everything else on this screen, see What's on the stock detail screen?; for how your P&L is calculated using this same depth data, see What is P&L based on market depth?