
A moving average smooths a stock's price history into a single flowing line, so you can see the underlying direction without the day-to-day noise. The simple moving average (SMA) averages the last N closing prices equally; the exponential moving average (EMA) gives extra weight to the most recent prices.
How is a moving average calculated?
Take a 5-day SMA of Bharat Paints Ltd. Its last five closes were ₹500, ₹504, ₹498, ₹510 and ₹513. Add them (₹2,525), divide by 5. The 5-day SMA today is ₹505. Tomorrow, the oldest close drops out, the newest joins, and the average "moves". Plot that value every day and you get a smooth line following the price.
The EMA uses the same idea but weights recent closes more heavily, so it reacts faster when price turns. That speed cuts both ways: the EMA hugs the price more closely, but it also gets faked out by short-lived swings more often. Neither version is "more correct". They trade smoothness for responsiveness differently.
| SMA | EMA | |
|---|---|---|
| Weighting | All N days equal | Recent days count more |
| Reaction to turns | Slower | Faster |
| Noise | Smoother | Jumpier |
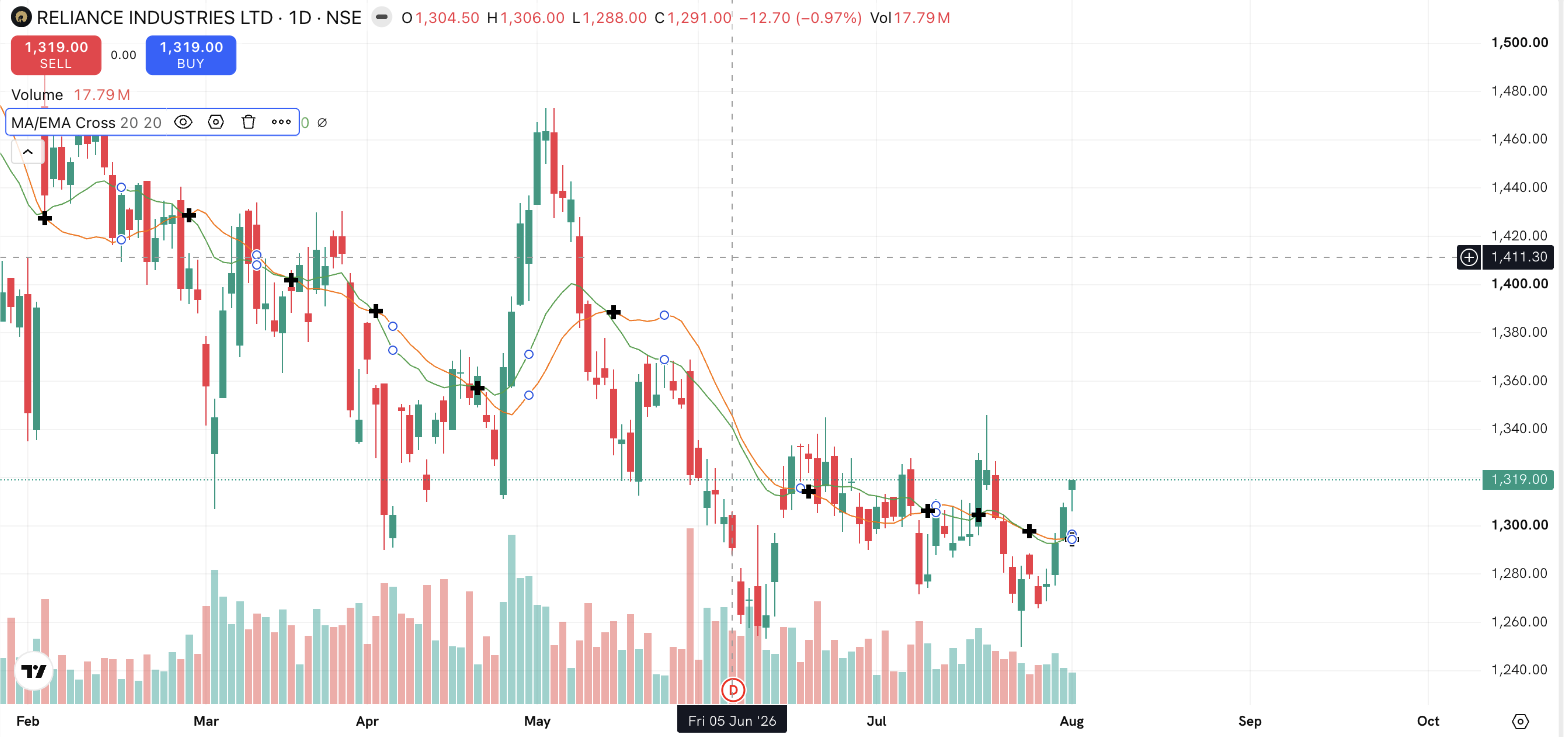
Both lines above are set to the same length, 20 periods, so the only difference between them is the weighting. Watch what happens at each turn: the green EMA bends first and the orange SMA follows a few candles later. That is the entire trade-off in one picture. Notice too how often the two lines cross in the flat stretch on the right, and how rarely they cross during the steady slide before it.
The number matters more than the type: a 20-day average tracks the recent swing, a 200-day average tracks the long arc. Common choices are 20, 50, 100 and 200 periods.
Why do people talk about the 50-DMA and 200-DMA?
The 50-day and 200-day moving averages (DMA = daily moving average) are the most widely watched, mostly because everyone watches them. A stock trading above its rising 200-DMA is conventionally described as being in a long-term uptrend; below a falling 200-DMA, a long-term downtrend. Financial media and analysts quote these levels constantly, which gives them a self-referential importance. Many eyes on the same line means many decisions cluster near it. That makes them useful reference points; it does not make them barriers the price must respect.
What is a moving-average crossover?
A crossover happens when a faster average crosses a slower one. When the 50-DMA crosses above the 200-DMA, chartists call it a golden cross; when it crosses below, a death cross. Dramatic names, but stated neutrally: a golden cross only records that the average price of the last 50 days has overtaken the average of the last 200, i.e. the medium term has been stronger than the long term. Traders watch these events as markers that the tone has already shifted. Because averages are built from past prices, crossovers lag: by the time a golden cross prints, much of the rise that caused it has already happened, and in sideways markets crossovers flip back and forth unprofitably. The MACD indicator builds directly on EMA crossovers, and moving averages also feed intraday tools like VWAP's cousin studies.
Some traders also watch how price behaves around an average. Buying interest repeatedly appearing near a rising 50-DMA is often interpreted the way support is. Same caveat: it holds until it doesn't.
Things to keep in mind
- Moving averages summarise the past by construction. Every reading lags the price. They describe, they don't forecast.
- In ranging markets, averages flatten and crossovers whipsaw; trend tools work worst exactly when there's no trend.
- 50 and 200 are conventions, not magic numbers. Their significance comes from how many people watch them.
- Use averages to frame context (above/below, rising/falling), and manage risk with explicit orders. Never with the line itself.
Read next
What is RSI (Relative Strength Index)? — An indicator measuring momentum rather than direction.