
VWAP (the volume-weighted average price) is the average price at which a stock has actually traded so far today, with each trade weighted by its size. It appears as a single curving line on intraday charts and answers one question: "what has the typical rupee paid for this stock today?"
How is VWAP different from a normal average?
A simple average treats every price equally. VWAP weights each price by how many shares changed hands there, so prices where heavy business was done pull the line harder.
Take Lakshmi watching Deccan Cables, a fictional stock, in the first hour: 2 lakh shares trade around ₹100, then just 20,000 shares spike to ₹110. A plain average of the two prices says ₹105, but that flatters a thin move. VWAP says roughly ₹100.9, because ten times more stock actually changed hands near ₹100. That's the point: VWAP reflects where the real money traded, not where a few prints wandered. (It's closely related to the ATP figure shown in your positions. See what do LTP, ATP and volume mean.)
Two properties define it:
- It resets every morning. VWAP accumulates from the day's first trade and dies at the close. Yesterday's VWAP is irrelevant to today's line, which also means VWAP only makes sense on intraday timeframes, on a daily chart it has nothing meaningful to show.
- It gets heavier as the day ages. By afternoon, hours of accumulated volume anchor the line, so late-day prices barely bend it.
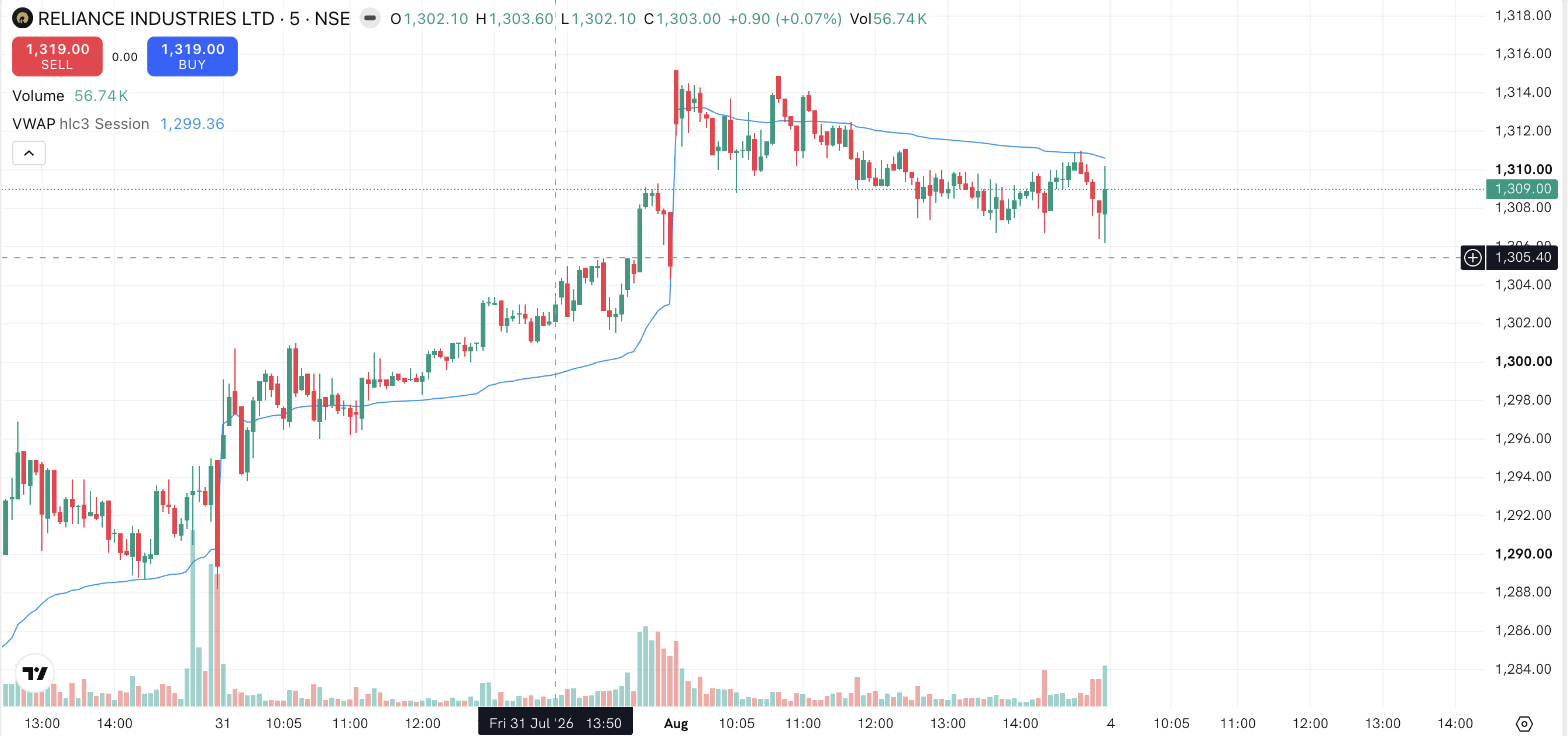
Both properties are visible above. At each session open the line breaks and restarts from that morning's first trades, and within each session it flattens out as the day goes on. That break is why VWAP belongs on a 5-minute or 15-minute chart, not a daily one.
Why do institutions care about VWAP?
Because it's their report card. When a fund must buy 5 lakh shares of Deccan Cables, the dealer's execution is often judged against VWAP: filling the order below the day's VWAP means they beat the day's typical price; above it, they paid up. Many institutional orders are even executed by algorithms that deliberately slice the order through the day to track VWAP.
This is why so many intraday traders keep VWAP on their charts: it marks the level big participants are being measured against, and heavy algorithmic activity clusters around it. Price above VWAP is conventionally described as "buyers in control today. The average buyer is in profit"; price below it, the opposite. Traders also often watch how price behaves when it returns to the VWAP line, treating it the way they treat any reference level. A spot where reactions have happened before, similar in spirit to support and resistance. As always, these are readings, not rules: price crosses VWAP many times on choppy days, and "above VWAP" has never obliged a stock to stay there.
When is VWAP least useful?
Early in the session, when only a few minutes of volume exist, the line whips around and means little. It's also distorted on days dominated by one huge block trade, and it says nothing about multi-day positioning. A Delivery investor holding for months gets little from a line that dies at 3:30 PM each day.
Things to keep in mind
- VWAP is a today-only measure. It resets at the open and is meaningful only on intraday charts.
- It describes where today's volume has traded; it does not predict where price goes next.
- "Above/below VWAP" is a widely watched convention precisely because institutions are benchmarked to it. That makes it a reference point, not a signal.
- On thin stocks or block-deal days, VWAP can be dragged by a single large trade; check volume before leaning on it.
Read next
What are gap-up and gap-down openings? — Finally, what to do when the chart opens with a hole in it.