
The Relative Strength Index (RSI) is an indicator that measures how fast and how one-sided a stock's recent price moves have been, on a scale of 0 to 100. High readings mean recent days have been dominated by gains; low readings mean losses have dominated.
How does RSI work?
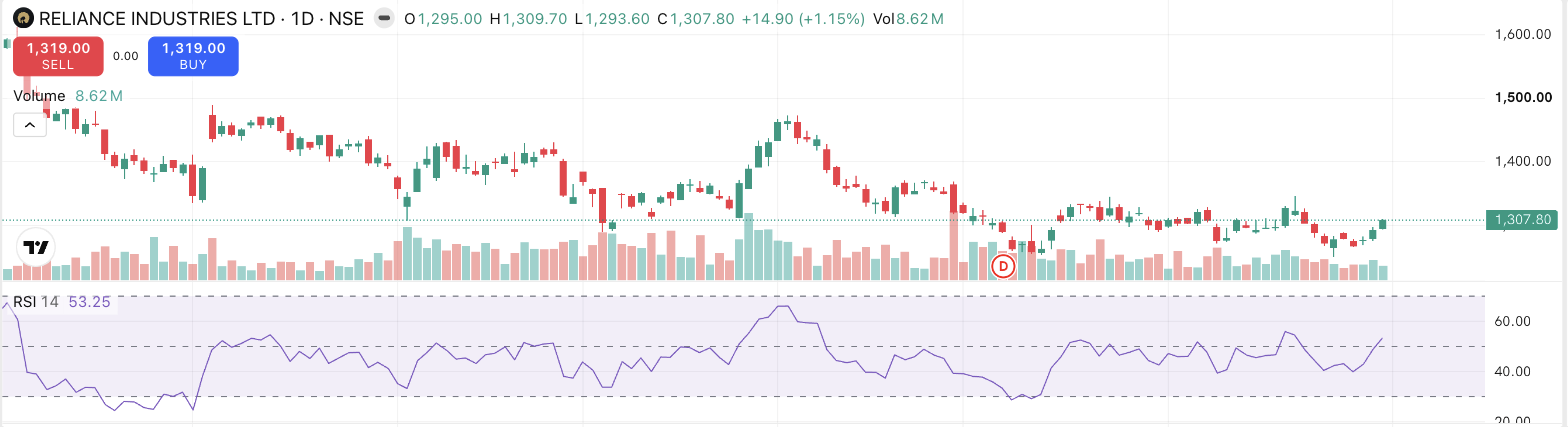
RSI compares the average size of up-moves to the average size of down-moves over a lookback window, 14 periods by default. If every one of the last 14 days closed higher, RSI approaches 100; if every day closed lower, it approaches 0; balanced days put it near 50. You don't need to compute it yourself. Every charting platform, including Rupeezy's charts, plots it in a panel below the price.
Read it as a speedometer for one-sidedness. When Anjali sees Kaveri Motors' RSI at 78, she learns one thing with certainty: the last fortnight's closes have been unusually tilted towards gains. What happens next is not part of the reading.
What do 70 and 30 mean?
By convention:
- RSI above 70. The stock is described as overbought: recent buying has been unusually fast.
- RSI below 30, described as oversold: recent selling has been unusually fast.
Treat these words carefully. They are labels for a calculation, not judgements from the market. "Overbought" does not mean "about to fall". In a strong uptrend, RSI can sit above 70 for weeks while the price keeps climbing; in a crash, it can stay pinned below 30 the whole way down. Some traders even invert the standard reading. Interpreting a persistently high RSI as evidence of a strong trend worth staying with rather than fading. The 70/30 lines are conventions the community has settled on, and different traders act on them in opposite ways.
| RSI zone | Conventional label | What it factually says |
|---|---|---|
| Above 70 | Overbought | Recent gains unusually fast/one-sided |
| 30–70 | Neutral | Gains and losses relatively balanced |
| Below 30 | Oversold | Recent losses unusually fast/one-sided |
What is RSI divergence?
Divergence is when price and RSI disagree at the extremes. Suppose Kaveri Motors makes a new high at ₹290, dips, then pushes to a higher high at ₹298, but RSI prints a lower peak the second time. Price made a higher high; momentum didn't. Traders often read bearish divergence like this as a note that the advance is being carried by less force, and the mirror image (lower price low, higher RSI low) as bullish divergence. Divergences are among the more respected RSI observations, and they still fail routinely, sometimes stretching across three or four "divergent" peaks before anything changes. They flag a mismatch worth investigating, nothing more.
Like all indicators, RSI is arithmetic on past closing prices. It contains no information the price chart doesn't already hold, and its values change entirely with the timeframe you're viewing. Many traders sanity-check RSI observations against volume and chart levels before acting.
Things to keep in mind
- RSI describes the recent past; no reading, however extreme, predicts the next move.
- "Overbought" can stay overbought for weeks in a trending stock. The 70/30 lines are conventions, not triggers.
- RSI values depend on the timeframe and the lookback setting; always note both before comparing readings.
- Indicators derived from price add perspective, not new information. Position sizing and stop-losses manage risk; RSI cannot.
Read next
What is MACD? — Trend and momentum combined into one widely used indicator.