
OHLC stands for Open, High, Low, Close, the four prices that summarise any period of trading. A chart's timeframe decides how long that period is: on a 5-minute chart each bar covers 5 minutes, on a daily chart each bar covers one full trading day.
What do the four OHLC values mean?
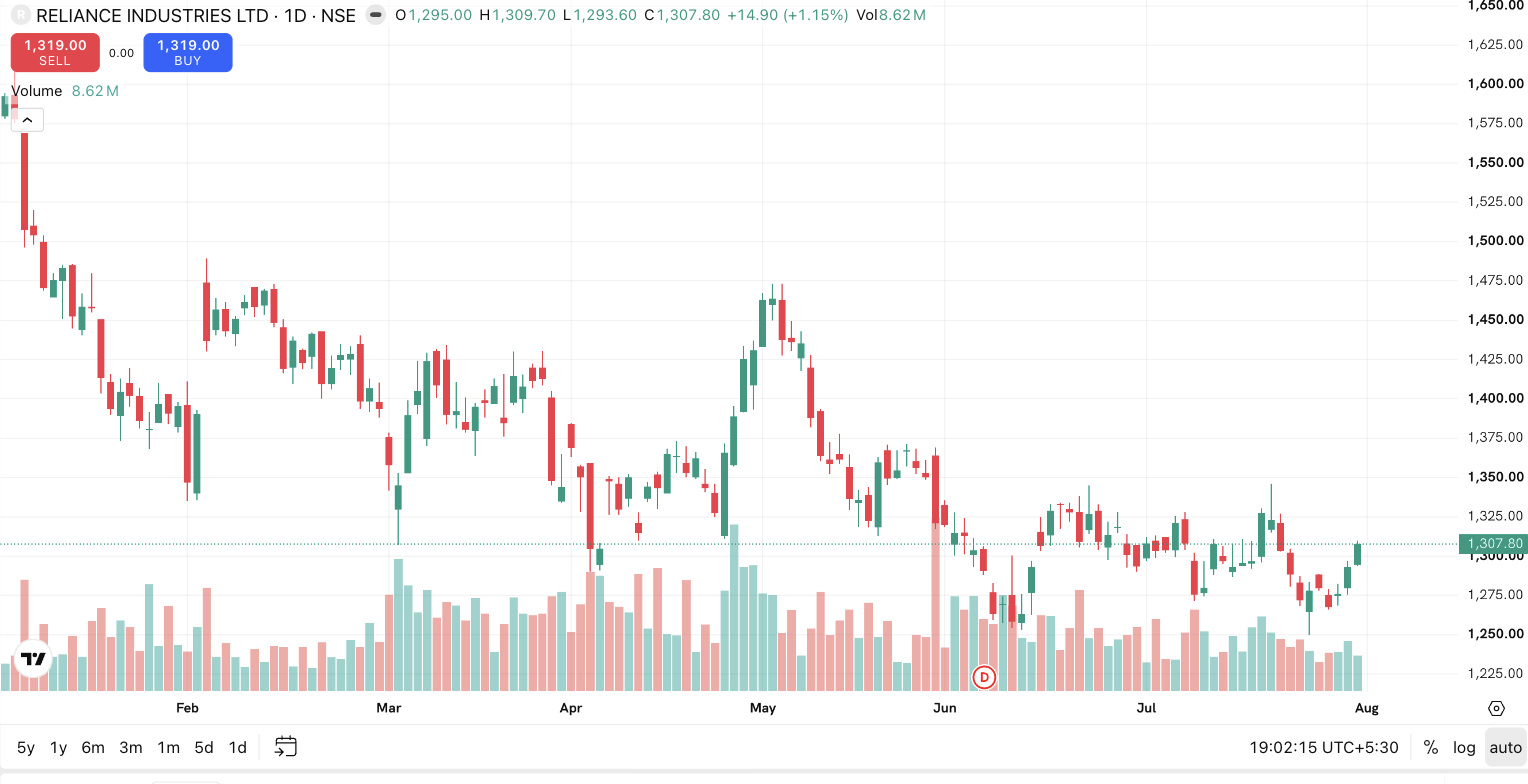
For any period. Say one trading day in Bharat Paints Ltd:
- Open, the first traded price of the period, e.g. ₹512.
- High, the highest price touched, e.g. ₹530.
- Low, the lowest price touched, e.g. ₹505.
- Close, the last traded price of the period, e.g. ₹524.
These four numbers are the raw material of almost everything in charting. A candlestick is just OHLC drawn as a body and wicks. Most indicators. moving averages, RSI, MACD, are calculated from closes (and sometimes highs and lows). If you understand OHLC, no chart will ever look mysterious again.
The close gets special respect. It's the price at which the market "settled its argument" for the period, so traders and many indicators treat the close as the most meaningful of the four.
How do timeframes work?
The timeframe is simply how much time each candle compresses:
| Timeframe | One candle covers | Typically watched by |
|---|---|---|
| 1-minute / 5-minute | 1 or 5 minutes | Intraday traders |
| 15-minute / 1-hour | 15 or 60 minutes | Intraday and swing traders |
| Daily | One trading day | Swing traders, investors |
| Weekly / Monthly | One week / one month | Long-term investors |
The same stock at the same moment can look completely different across timeframes. Suppose Bharat Paints has risen from ₹400 to ₹524 over three months but dropped ₹6 today. The weekly chart shows a steady climb; the 5-minute chart shows a red, falling day. Neither chart is wrong. They're answering different questions. Pick the timeframe that matches how long you intend to hold: minutes-to-hours traders live on intraday charts, while someone reviewing holdings monthly needs only daily and weekly views.
A useful habit is checking one timeframe above the one you trade on. Rahul, trading on the 15-minute chart, glances at the daily chart first to see the larger trend he's operating inside.
Why doesn't my chart's OHLC match the exchange website exactly?
You may occasionally notice small differences between the OHLC on a chart and the figures published by NSE or BSE, especially the open and close, which exchanges compute through their own auction and averaging processes rather than the plain first and last tick. If you spot this on a Rupeezy chart, it's usually a data-methodology difference, not an error; see why historical OHLC may not match NSE/BSE for the details.
Things to keep in mind
- OHLC describes what already happened in a period; it carries no information about the next period.
- Always confirm the timeframe before reading a chart. The most common beginner mistake is judging a stock from a timeframe that doesn't match the holding period.
- Indicator values change with the timeframe. "RSI is 70" means nothing until you say which timeframe it's on.
- Exchange-published open/close values can differ slightly from raw tick data because of how exchanges compute them.
Read next
How do I read a candlestick chart? — The most common way those four numbers get drawn.