
Support is a price zone where a stock's falls have repeatedly paused, because buyers stepped in there before. Resistance is a zone where rises have repeatedly stalled, because sellers showed up there before. They are observations about past behaviour, useful reference points, not walls.
What's the floor-and-ceiling analogy?
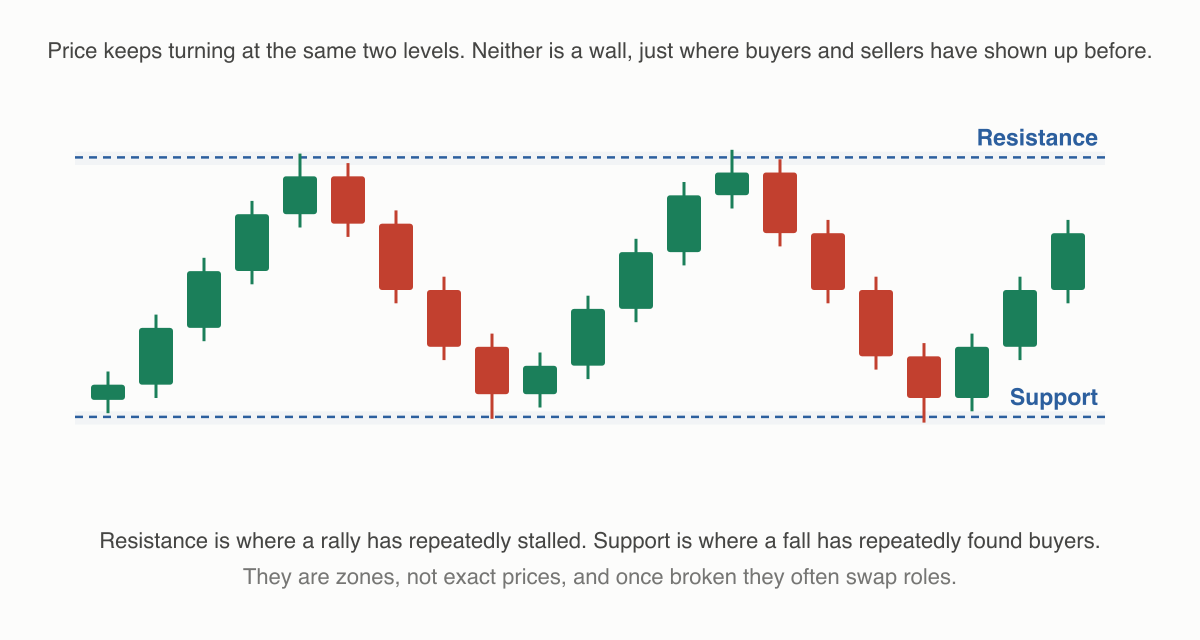
Picture the price bouncing inside a room. The floor is support: each time the price drops to that zone, buying interest has absorbed the selling and the fall paused. The ceiling is resistance: each time the price climbs there, selling pressure has capped it.
Say Himalaya Agro has bounced from around ₹340 three times in two months, and turned back down from around ₹390 twice. Traders would mark ₹340 as support and ₹390 as resistance. Why do such zones form? Memory and unfinished business. People who bought at ₹340 and watched it rally want to buy there again. People who bought near ₹390 before a dip are waiting to exit at break-even, creating selling pressure at that level.
Notice the word zone. Support at "₹340" really means "roughly ₹335–₹345". Prices rarely respect an exact rupee figure, so experienced chart readers draw bands, not razor-thin lines.
What is role reversal?
A widely watched behaviour: once a level breaks, it often swaps roles. If Himalaya Agro pushes through ₹390 and trades at ₹410, the old ceiling at ₹390 is often interpreted as the new floor. Traders who missed the move may look to buy near ₹390 on a dip, and those who sold there may buy back. The same happens in reverse: broken support is often watched as fresh resistance. Again, this is a tendency traders watch for, not a rule the market must obey.
Do these levels actually hold?
Sometimes, and sometimes they simply break. Let's be plain about this: support and resistance describe where the balance of buyers and sellers tipped in the past. A poor quarterly result, a sector-wide sell-off, or one large institutional order can slice through a level that held five times. There is no level that "cannot break", and a level breaking is not a malfunction of the method. It is the method telling you the balance has changed.
That's why traders pair levels with an exit plan. Divya buys near support at ₹340 with a stop-loss order a little below the zone: if the floor gives way, her loss is contained instead of hoped away. Levels also connect to other ideas in this folder. A decisive move through resistance is what traders call a breakout, and sloped versions of these levels are trendlines.
How do I track a level without staring at the screen?
You don't need to watch all day. On Rupeezy you can set a price alert at your support or resistance level and get notified when the price reaches it. Then look at the chart and decide.
Things to keep in mind
- Treat levels as zones, not exact prices, and expect some overshoot on both sides.
- The more times a level has been tested recently, and the higher the volume near it, the more traders tend to watch it, but no amount of history prevents a break.
- A broken level often reverses roles (old resistance watched as new support, and vice versa).
- Never rely on a level alone to protect capital; that's what stop-losses are for.
Read next
What is a breakout, and what is a false breakout? — What happens when price finally clears one of those levels — genuinely or not.