
A breakout is when a stock's price moves decisively through a level it had repeatedly failed to cross, above a resistance or below a support. A false breakout is the trap version: price pokes through the level, pulls in traders who chased it, and then reverses back, leaving them stuck at bad prices.
What makes a move a "breakout"?
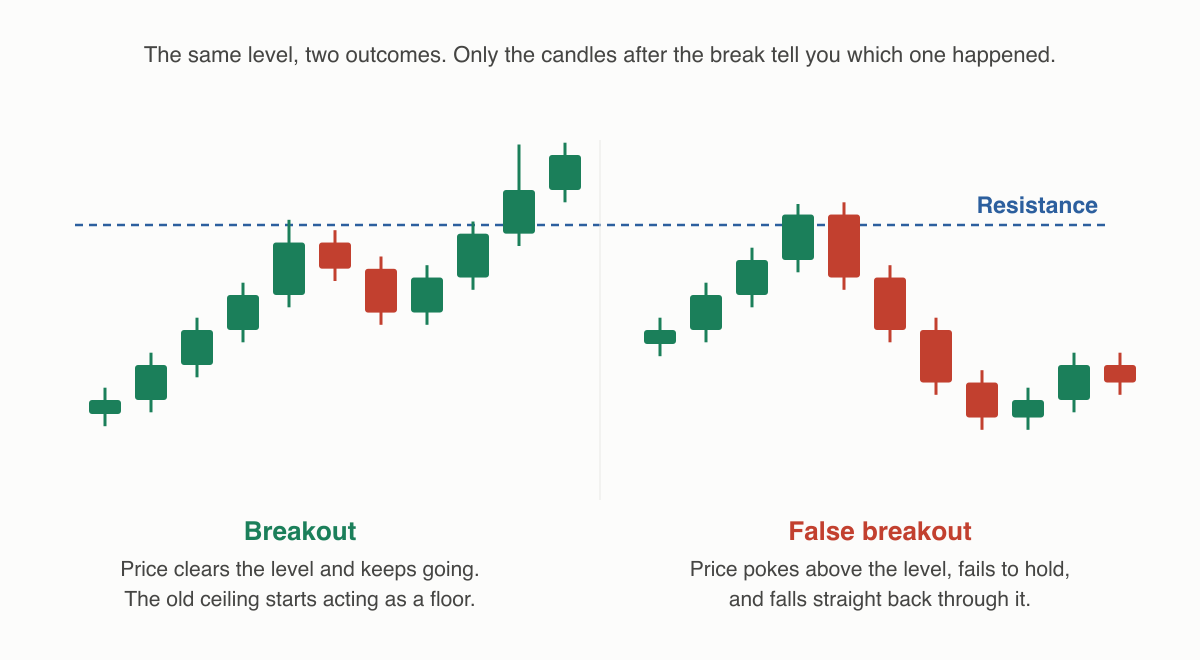
Levels form where the market has repeatedly changed its mind. The ceilings and floors described in what are support and resistance. When price finally pushes through one, chart readers treat it as news: the balance that held that level has shifted. Breakouts also come out of chart patterns. A range, a trendline, or the neckline of the reversal patterns.
Because a level is a zone rather than a line, traders look for a decisive break: typically a close beyond the level (not just an intraday poke), by a margin that isn't trivial. The most common confirmation they add is volume. A break of a six-week ceiling on triple the average volume is read as broad participation, while the same break on thin volume is read with suspicion. Volume confirmation improves the quality of the observation; it still doesn't make the outcome certain.
What does a false breakout look like in practice?
Let's watch one trap a trader. Godavari Foods has bumped against ₹180 four times in two months. Arjun has been waiting: "when it crosses ₹180, I'm in."
On Tuesday at 11 a.m., the stock prints ₹181.50. Arjun buys at ₹181.60, expecting the open road above. Volume, had he checked, was unremarkable. By 1 p.m. the stock is back at ₹178; by Thursday it's ₹172. The "breakout" lasted ninety minutes. Arjun is now holding a loss bought at nearly the highest price of the month, along with everyone else who chased the same tick above ₹180. Their selling, as they give up, adds to the fall. That crowd of trapped buyers is exactly why false breakouts are often followed by sharp moves the other way, and why some traders specifically wait to trade the failure rather than the break.
What could Arjun have done differently? Not predicted it (nobody can) but structured it:
- Wait for a close beyond the level, or even a retest (price breaking out, pulling back to ₹180, and holding it, old resistance behaving as new support) before entering.
- Check volume on the break for signs of real participation.
- Predefine the exit. A stop-loss order just back inside the range (say ₹177) turns a trap into a small, planned loss instead of a hopeful hold down to ₹172.
- Let the level come to him. A price alert at ₹180 lets him assess the break calmly instead of buying the first spike.
Can you tell a real breakout from a false one in advance?
No. That's the honest core of this topic. Every false breakout looks identical to a real one in its first minutes; the difference only exists in hindsight. Filters like closing basis, volume, and retests shift the odds of acting on noise, but plenty of confirmed, high-volume breakouts fail anyway. Breakout traders survive not by picking winners but by keeping the losses on failures small and predefined.
Things to keep in mind
- A breakout is an observation that a watched level gave way, not a promise of follow-through.
- False breakouts are common, and they punish chasers hardest; the trapped crowd often fuels the reverse move.
- Confirmation tools (closes, volume, retests) filter noise; none of them eliminates failure.
- Decide the invalidation point before entering any breakout trade, and enforce it with a stop-loss, not willpower.
Read next
What are double tops and head-and-shoulders patterns? — Support and resistance combine into the classic reversal formations.