
Volume is the number of shares that changed hands during a period, and it matters because it shows how much real participation stood behind a price move. A price change on heavy volume means many traders backed it with money; the same change on thin volume means very few did.
What exactly is the volume bar showing me?
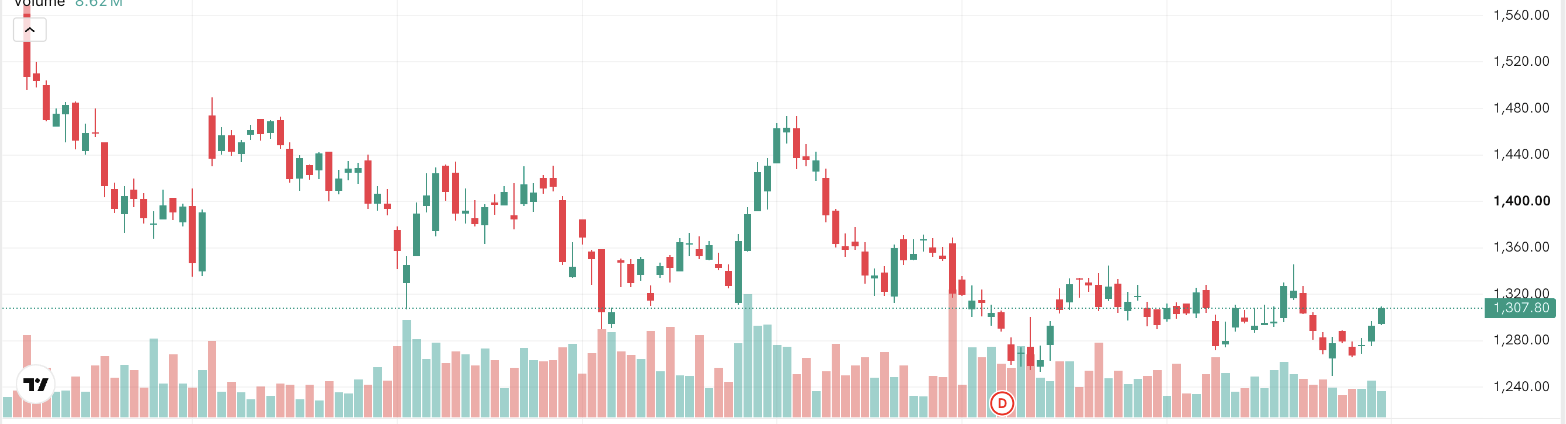
Under most charts you'll see a row of vertical bars, one per candle. Each bar is the total quantity traded in that candle's period. If Sundar Textiles trades 8 lakh shares on Monday and 55 lakh on Tuesday, Tuesday's bar towers over Monday's. (Every trade needs both a buyer and a seller, so volume counts transactions, not "more buyers than sellers".) If terms like volume, LTP and ATP are new to you, start with what do LTP, ATP and volume mean.
Price tells you what the market decided; volume hints at how many participants were part of that decision. That's the entire reason chartists rarely read one without the other.
How does volume confirm a move?
Traders often say volume "confirms" price. The logic: a move that attracts rising participation reflects genuine, broad interest, so it is often interpreted as more meaningful.
Suppose Sundar Textiles has been stuck under resistance at ₹150 for six weeks. On Thursday it closes at ₹156, and volume is four times its recent average. Chart readers would call that a volume-backed breakout: a large number of traders paid up to own the stock above ₹150, which is harder to dismiss as noise.
The same applies in downtrends. Falls on expanding volume are read as conviction selling, while a decline on shrinking volume is often read as drift rather than distribution.
How does volume contradict a move?
Now flip it. The stock crosses ₹150, but volume is below average. Price says "breakout"; volume says "hardly anyone came". Traders read this divergence as a caution flag. Thin moves are more easily produced by a handful of orders and more easily reversed. It doesn't mean the move will fail; low-volume moves sometimes run a long way. It means one of the two witnesses is not corroborating the story.
A quick reference table:
| Price action | Volume | Common reading |
|---|---|---|
| Rising | Rising | Broad participation behind the rise |
| Rising | Falling | Rally thinning out, watched with caution |
| Falling | Rising | Conviction selling |
| Falling | Falling | Drift; sellers not aggressive |
Treat these as conventions traders use to organise what they see, not outcomes the market owes anyone.
Anything else volume tells me?
Volume is also a practical liquidity check. A stock that trades only a few thousand shares a day is hard to enter and exit without moving the price yourself. The bid-ask spread tends to be wide, and a market order can fill at a surprisingly bad price. Before trading any unfamiliar stock, a glance at its average daily volume is basic hygiene. Also compare volume to the stock's own recent average: 5 lakh shares is huge for a small company and a rounding error for a Nifty 50 heavyweight.
Things to keep in mind
- Always read volume relative to the stock's own recent average, not as an absolute number.
- Volume adds context to price; the pair together still cannot predict the next move.
- Very low-volume stocks carry a practical risk beyond charting: you may struggle to exit at a fair price.
- One-off volume spikes can come from block deals or index changes. A spike is a reason to look closer, not a signal by itself.
Read next
What are moving averages (SMA and EMA)? — From raw price to your first indicator.