
Technical analysis is the study of a stock's past price and trading volume (usually on a chart) to understand how buyers and sellers have been behaving. It is a way of organising market information, not a method of predicting the future.
What does a technical analyst actually look at?
A price chart records every battle between buyers and sellers. Technical analysis reads that record: where the price has repeatedly stalled, how strong recent moves were, whether volume rose or faded along the way. From these observations, traders build tools. candlestick charts, support and resistance levels, moving averages, and dozens of indicators.
The core assumption is that market psychology leaves footprints. If Sundar Textiles fell from ₹480 to ₹400 last month, many buyers who paid ₹480 are waiting to exit at break-even. Technical analysis doesn't know their names, but it notices that the price struggles near ₹480, and gives that observation a label.
How is it different from fundamental analysis?
Fundamental analysis studies the business; technical analysis studies the price action. Most investors use some blend of both.
| Technical analysis | Fundamental analysis | |
|---|---|---|
| Studies | Price and volume on charts | Profits, balance sheet, management, industry |
| Asks | "How are traders behaving?" | "What is this business worth?" |
| Time horizon | Minutes to months | Usually years |
| Typical user | Traders timing entries and exits | Long-term investors picking businesses |
Neither approach is "better". Kavita may pick Himalaya Agro after reading its annual report (fundamental) and then look at the chart to decide whether to buy today or wait (technical).
Does technical analysis actually work?
Here is the honest answer: technical analysis describes what has happened; it cannot guarantee what happens next. A level that held five times can break on the sixth. An indicator that looked reliable for months can stop mattering the day unexpected news arrives. Two experienced traders can look at the same chart and read it in opposite ways.
What the toolkit genuinely offers is discipline. It gives you a framework for deciding in advance where you would enter, where you would accept you were wrong, and how much you would risk, for example, by pairing a chart level with a stop-loss order. Traders who benefit from technical analysis usually credit that discipline, not any single magic indicator.
How do I start looking at charts?
Begin with the basics in this folder, in roughly this order: reading a candlestick, OHLC and timeframes, support and resistance, and trends. Once those feel natural, indicators like RSI and MACD will make far more sense. They are all derived from the same price and volume data you'll already understand. On Rupeezy you can open a chart and practise on any stock; you can even place orders directly from the chart on the web platform.
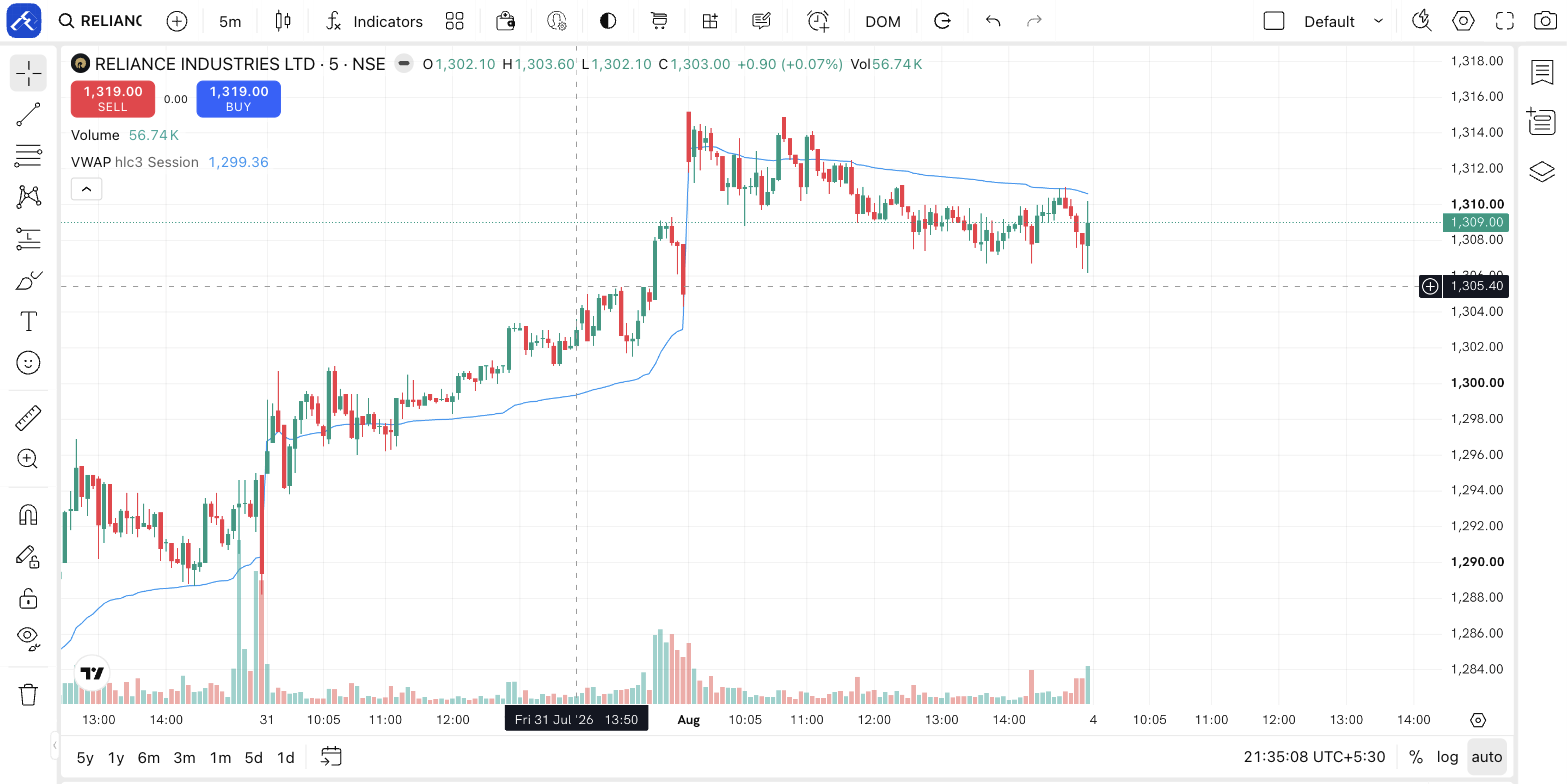
Everything a technical analyst uses is on that one screen. The candles and the volume bars are the raw record; the timeframe buttons decide how much history each candle covers; the drawing tools let you mark levels by hand; and the Indicators menu adds calculated overlays like the blue VWAP line here. Nothing in the toolbar knows anything the price and volume data doesn't. It is all arithmetic on the same numbers.
Things to keep in mind
- Technical analysis organises information; it does not predict. Any tool can and will give readings that don't play out.
- No indicator works in isolation, traders combine chart levels, volume, and their own risk rules.
- Past price behaviour is history, not a promise. News, results, and global events can override any chart pattern instantly.
- Decide your exit before you enter. The chart can suggest levels, but the risk decision is always yours.
Read next
What are OHLC and chart timeframes? — Every chart is built from four numbers and a choice of timeframe.