
A double top and a head-and-shoulders are larger chart shapes (built from many candles over weeks or months) that traders classify as reversal patterns: formations that have sometimes appeared near the end of uptrends. They describe a market that tried to keep rising and couldn't; they do not guarantee a fall.
What does a double top look like?
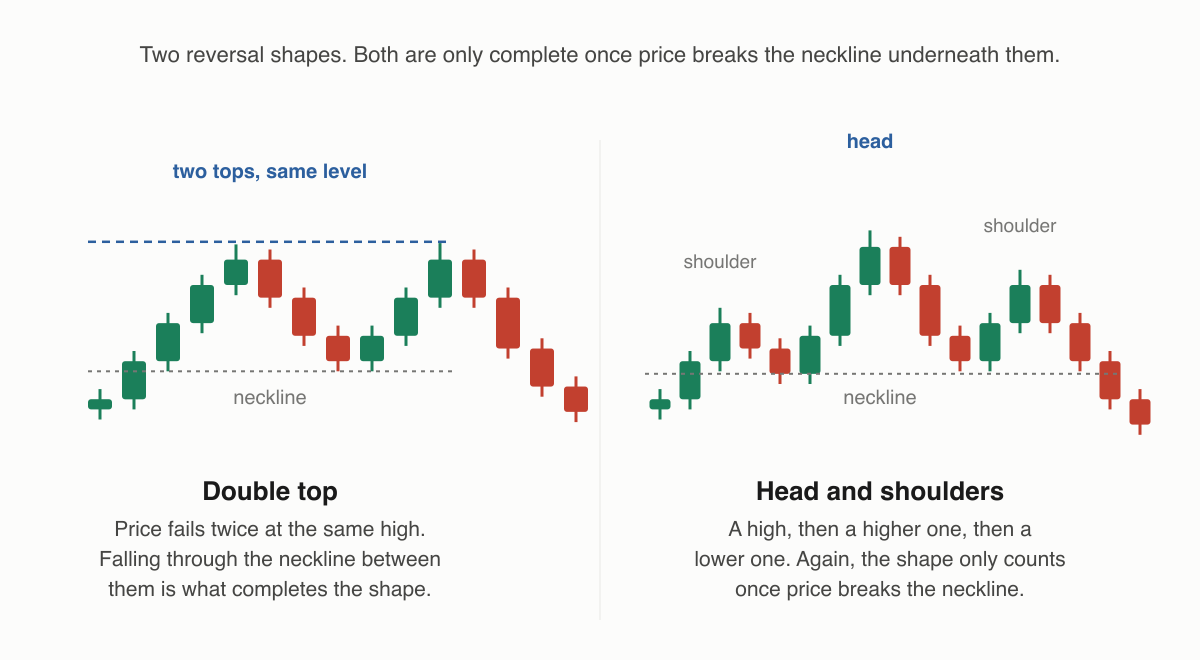
Price rallies to a high, pulls back, rallies again to roughly the same high, and turns down a second time. The chart traces the letter "M". Say Kaveri Motors runs up to ₹500, slips to ₹450, climbs back to ₹498, and rolls over again. Two attempts at the same ceiling, two rejections. The level around ₹500 behaved as firm resistance.
The dip between the two peaks (₹450 here) defines the neckline. Chartists only call the pattern "complete" if price then breaks below the neckline; until that happens, the stock is simply rangebound between ₹450 and ₹500, and could just as easily break upward. The mirror-image "W" after a downtrend is a double bottom, read the same way upside-down.
What is a head-and-shoulders?
Three peaks: a rise (left shoulder), a higher rise (the head), then a weaker rise that fails below the head (right shoulder). The line connecting the two dips between the peaks is the neckline. The story traders read into it: the uptrend made one final higher high (the head), and then the next rally couldn't even match it. The sequence of higher highs that defines an uptrend visibly broke down. Again, the pattern is only considered complete when price closes below the neckline. An upside-down version after a downtrend is called an inverse head-and-shoulders.
| Pattern | Shape | Neckline | Conventionally read as |
|---|---|---|---|
| Double top | "M" | The dip between peaks | Uptrend failing at a ceiling |
| Double bottom | "W" | The bounce between troughs | Downtrend failing at a floor |
| Head-and-shoulders | Three peaks, middle tallest | Line under the two dips | Uptrend losing its rhythm |
How reliable are these patterns?
Bluntly: they fail often, and you should expect that going in. Three failure modes are routine. First, the pattern never completes, price bounces off the neckline and resumes rising, and what looked like a "double top forming" becomes just a pause. Second, the false break — price dips below the neckline for a day or two, traps sellers, and reverses back up (the same trap mechanics covered in what is a breakout and a false breakout). Third, hindsight bias: these shapes are easy to spot in old charts and genuinely hard to trade live, because a half-formed pattern is indistinguishable from ordinary chop.
Traders who use these patterns typically wait for a decisive neckline break, often wanting expanding volume on the break, and predefine the exit if the break reverses. Priya, watching that Kaveri Motors "M", doesn't short at ₹498 because "it's a double top"; the pattern only tells her where her thesis would be wrong (back above the peaks) and what would count as confirmation (a close below ₹450).
Things to keep in mind
- No pattern exists until the neckline breaks; before that, it's just a range.
- These formations fail routinely, necklines produce false breaks, and half-formed patterns dissolve into noise.
- Bigger patterns (weeks or months of candles) are watched more seriously than tiny intraday versions, but size is no guarantee either.
- Use patterns to define risk points, and protect the position with a stop-loss order rather than conviction.
Read next
Why does volume matter in chart analysis? — The confirmation that separates a real move from a fake one.