
Bollinger Bands are an envelope drawn around a stock's moving average. An upper band and a lower band that widen when the price has been swinging hard and squeeze together when it has been quiet. They give you a live picture of volatility, drawn right on the price chart.
How are the bands built?
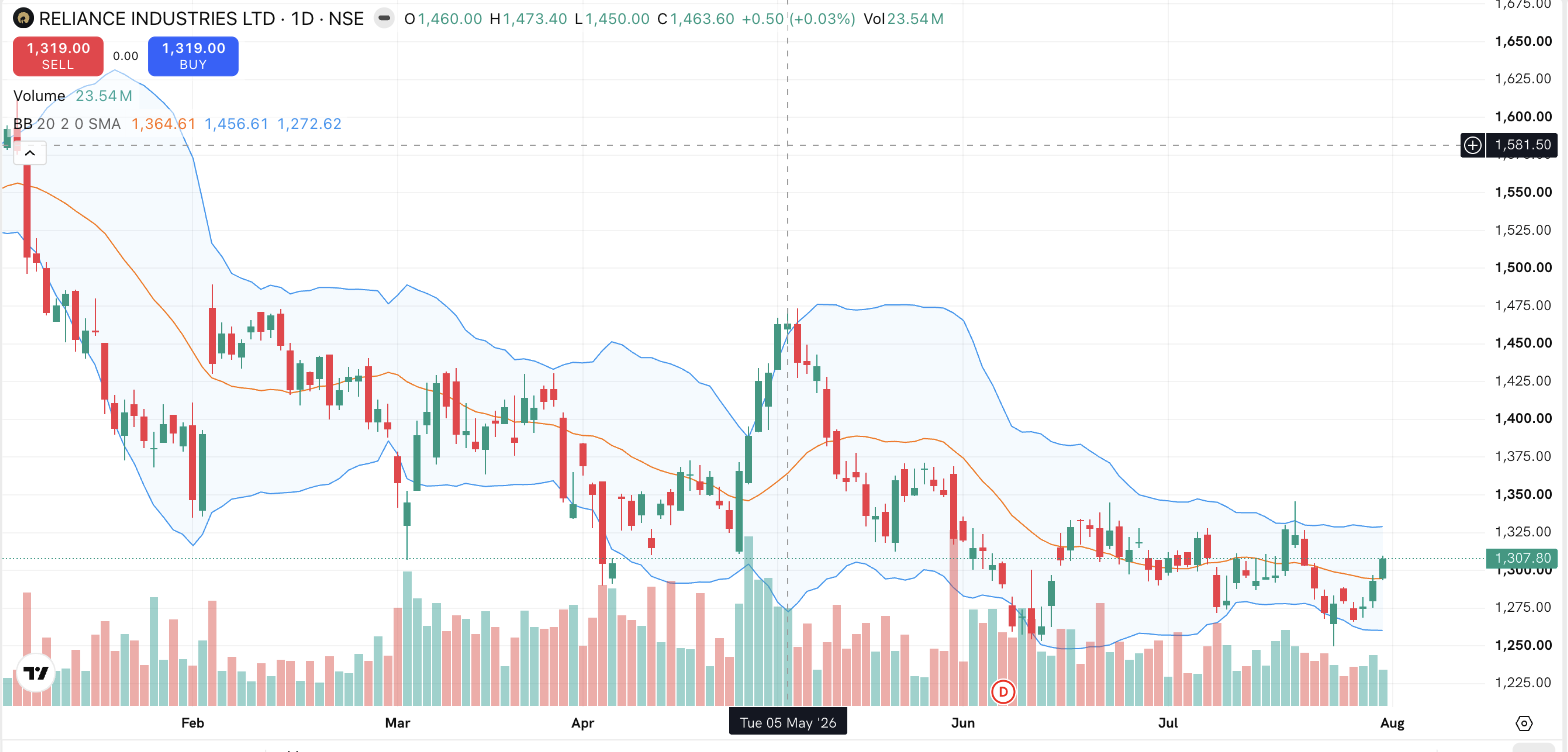
Three lines make up the study:
- Middle band. A 20-period simple moving average (SMA) of the closing price.
- Upper band, the middle band plus two standard deviations of recent prices.
- Lower band, the middle band minus two standard deviations.
Standard deviation is a statistical measure of how spread out recent prices have been. That's the whole trick: when Sundar Textiles chops around wildly, its recent prices are widely spread, the deviation is large, and the bands balloon apart. When it goes quiet and trades in a tight range, the deviation collapses and the bands pinch inwards. The bands don't cause anything. They're a running measurement of the stock's own recent turbulence. For the broader idea of volatility (and how the market tracks it index-wide), see what is volatility and what is India VIX.
What do traders look for?
Three commonly watched behaviours:
- The squeeze. After a long quiet spell the bands contract to their narrowest in months. Traders read a squeeze as stored-up energy. Volatility tends to alternate between quiet and stormy phases, so an unusually calm stretch is often followed by a livelier one. Note what the squeeze does not say: it gives no direction. Vikram sees Sundar Textiles' bands pinch after six quiet weeks around ₹95–₹100 and concludes only that a bigger move may be brewing — up or down, the bands don't vote.
- Touching or riding a band. Price tagging the upper band means it's stretched about two deviations above its 20-day average, statistically far from home. Some traders interpret band touches as stretched conditions that often pull back towards the middle; others point out that in a strong trend, price can "walk the band", touching the upper band candle after candle for weeks while rising the whole time. Both readings coexist, which tells you a band touch alone decides nothing.
- The middle band as a reference. In trending phases, pullbacks often pause near the 20-SMA, so traders watch it the way they watch any support or resistance zone, as a spot where reactions have happened before.
Are the bands a buy or sell signal?
No, and this is the most common beginner misreading. "Price at the lower band" is a statement about statistics, not value: it means the stock is unusually far below its short-term average, which happens both in routine dips and in genuine collapses. A falling stock can slide down the lower band for weeks. The bands frame questions (is this stock quiet or stormy? stretched or near its average?) and the trader still has to answer them with other evidence and explicit risk control.
Things to keep in mind
- Band width measures recent volatility, nothing else. Wide bands = stormy past fortnight; narrow bands = quiet one.
- A squeeze hints that volatility may pick up but says nothing about direction.
- Price can ride a band for extended periods in strong trends. A band touch is not a reversal signal.
- The 20-period / 2-deviation settings are conventions; changing them redraws every "signal" the bands appear to give.
Read next
What is VWAP? — The intraday benchmark professionals actually trade against.