
The 52 Week Range shows the lowest and highest price an instrument has traded at over the past year. It sits on the Overview tab, right next to Volume.
Where do I find the 52-week high and low?
On the Rupeezy app, open the instrument and scroll to Overview. 52 Week Range shows the low and high as a single figure, for example 275.0 - 427.0 on ITC.
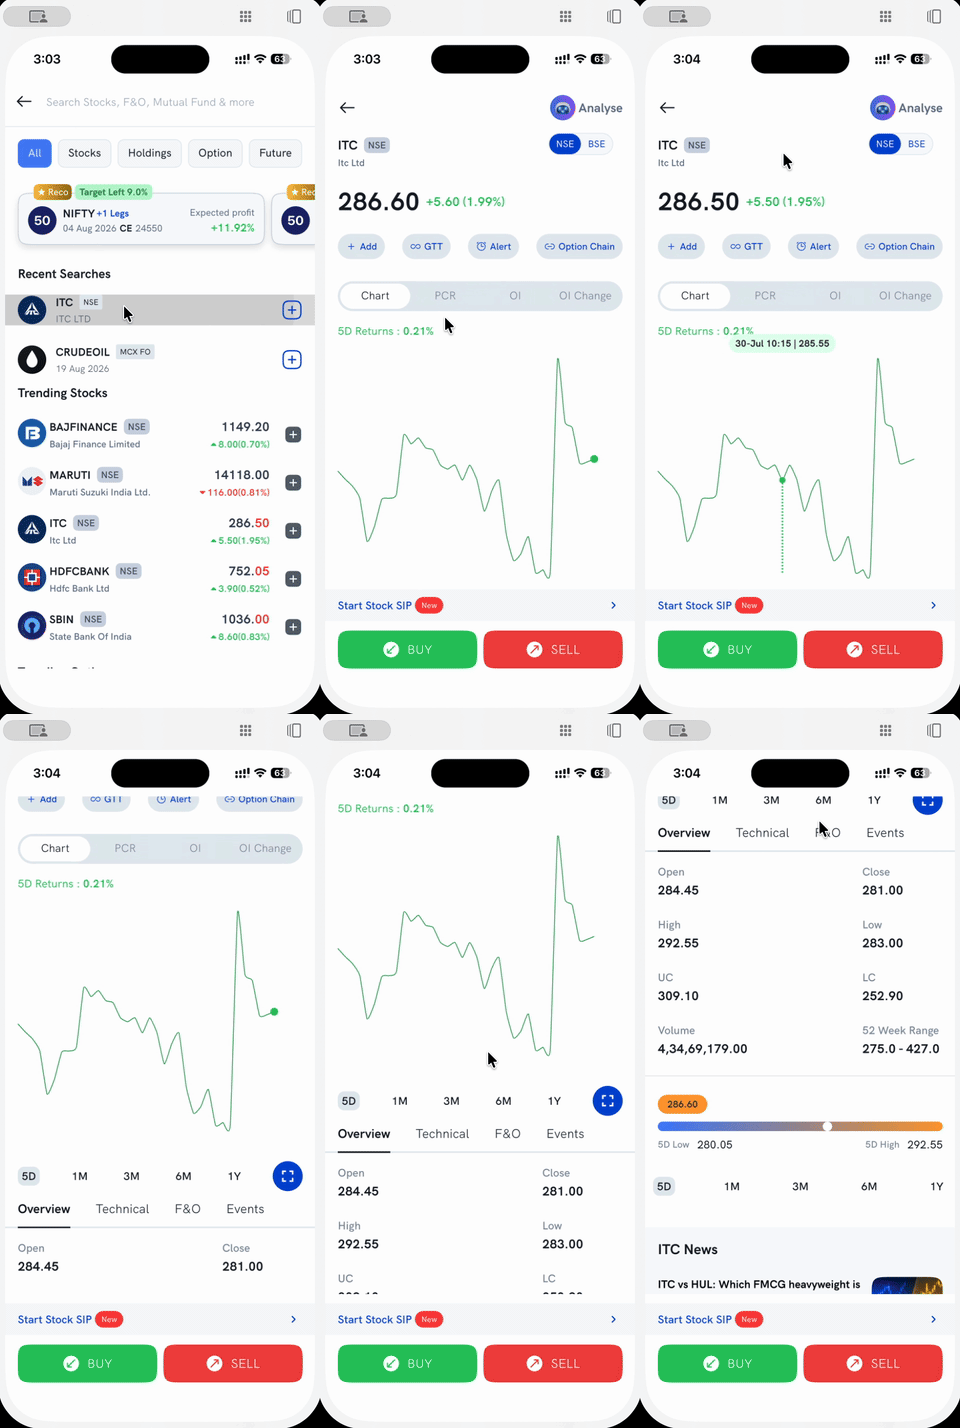
This is the same Overview tab on any instrument's detail screen — stocks, indices, and MCX commodity contracts alike. See How to view commodity contract details on Rupeezy? for how it looks on a commodity contract.
Good to know
- It's different from the Day's Range, which is today's low-to-high only. See What does the Day's Range on Rupeezy represent?
- It's also different from the range slider below Overview (5D / 1M / 3M / 6M / 1Y). The slider shows the low and high for whichever period you pick there — 52 Week Range is a fixed one-year figure shown on its own, not tied to the slider.