
Candlestick patterns are recurring candle shapes that traders have given names (doji, hammer, engulfing and others) and read as clues about the mood of buyers and sellers. Each pattern is a description of what happened inside one or two candles, which traders then interpret; no pattern guarantees what the next candle brings.
Before this article, make sure you can read a single candlestick. Every pattern below is just body-and-wick logic.
Which patterns should a beginner know first?
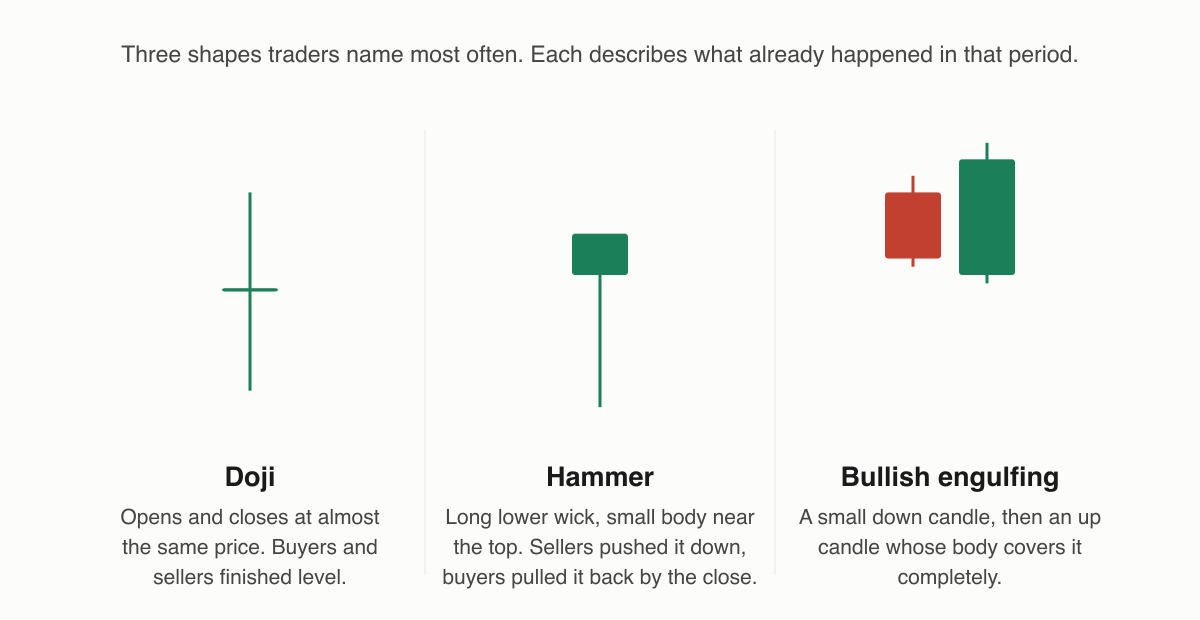
Doji. A candle where the open and close are almost equal, leaving a tiny body with wicks on either side. Say Himalaya Agro opens at ₹400, roams between ₹392 and ₹407, and closes at ₹401. Buyers and sellers fought to a draw. Traders read a doji as indecision, and pay it extra attention when it appears after a long one-sided run, where it's often interpreted as the first hesitation in the trend.
Hammer. A small body near the top of the candle with a long lower wick. Price fell hard intraday but was bought back up to close near where it opened. Appearing after a decline, it is often read as evidence that sellers pushed and buyers pushed back. The mirror image after a rise (long upper wick, body near the low) is called a shooting star, read as buyers trying and failing to hold the highs.
Bullish engulfing. A two-candle pattern: a red candle, then a green candle whose body completely swallows the previous body, for example a red ₹310→₹302 day followed by a green ₹300→₹315 day. Sellers had the first day; buyers took the second more emphatically. Traders read it as a sharp shift in control within two sessions.
Bearish engulfing. The reverse: a green candle followed by a larger red body that engulfs it, often interpreted as sellers wresting back control after a rise.
| Pattern | Candles | Often interpreted as |
|---|---|---|
| Doji | 1 | Indecision; a stand-off |
| Hammer | 1 | Sellers rejected after a decline |
| Shooting star | 1 | Buyers rejected after a rise |
| Bullish engulfing | 2 | Control shifting to buyers |
| Bearish engulfing | 2 | Control shifting to sellers |
Does where the pattern appears matter?
Very much. Context is most of the reading. A hammer printed at a level where the stock has bounced twice before (support) gets far more attention than the same hammer mid-air in a featureless chart. Likewise, traders weigh patterns more when volume expands on the deciding candle, and check the pattern against the prevailing timeframe. A "hammer" on a 5-minute chart is one small skirmish, not a campaign.
How reliable are these patterns?
Honestly: they fail all the time. A textbook bullish engulfing can be followed by a gap-down on bad news the next morning; dojis appear constantly and mostly mean nothing. Patterns earn their keep as a vocabulary (a fast way to describe who won a session's fight) and as prompts to look closer, not as instructions. Traders who use them typically wait for the next candle or a level break to act, and always define the exit first.
Things to keep in mind
- A pattern describes the last one or two candles; it carries no promise about the next one.
- Context does the heavy lifting. The same shape means little away from a meaningful level or without volume.
- Every pattern has a failure mode, and overnight news can override any of them at the open.
- Learn a handful well rather than memorising fifty names; the underlying logic is always the same buyer-versus-seller story.
Read next
What are a trend and a trendline? — Zoom out from single candles to the direction they add up to.