The Multi Layout chart feature allows you to view charts for multiple scrips on a single screen, enabling you to track several symbols simultaneously for better decision-making in real-time.
How do I use a multi-layout chart?
-
Open the chart for any scrip of your choice.
-
Tap the "Layout Type" button.

-
Select your preferred layout; multiple chart layouts will be displayed.
-
Choose a layout section where you want to add new scrips.
-
Tap the plus (+) button at the top right corner of the screen.
-
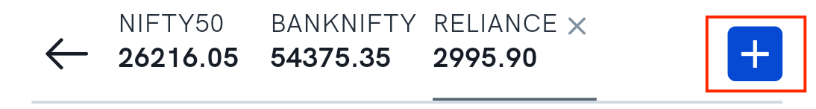
Search for and select your desired scrip. The chart for the selected scrip will load and be added to the header for quick access (up to 6 scrips can be added to the header).
-
To quickly switch between charts, simply tap on any scrip listed in the header.
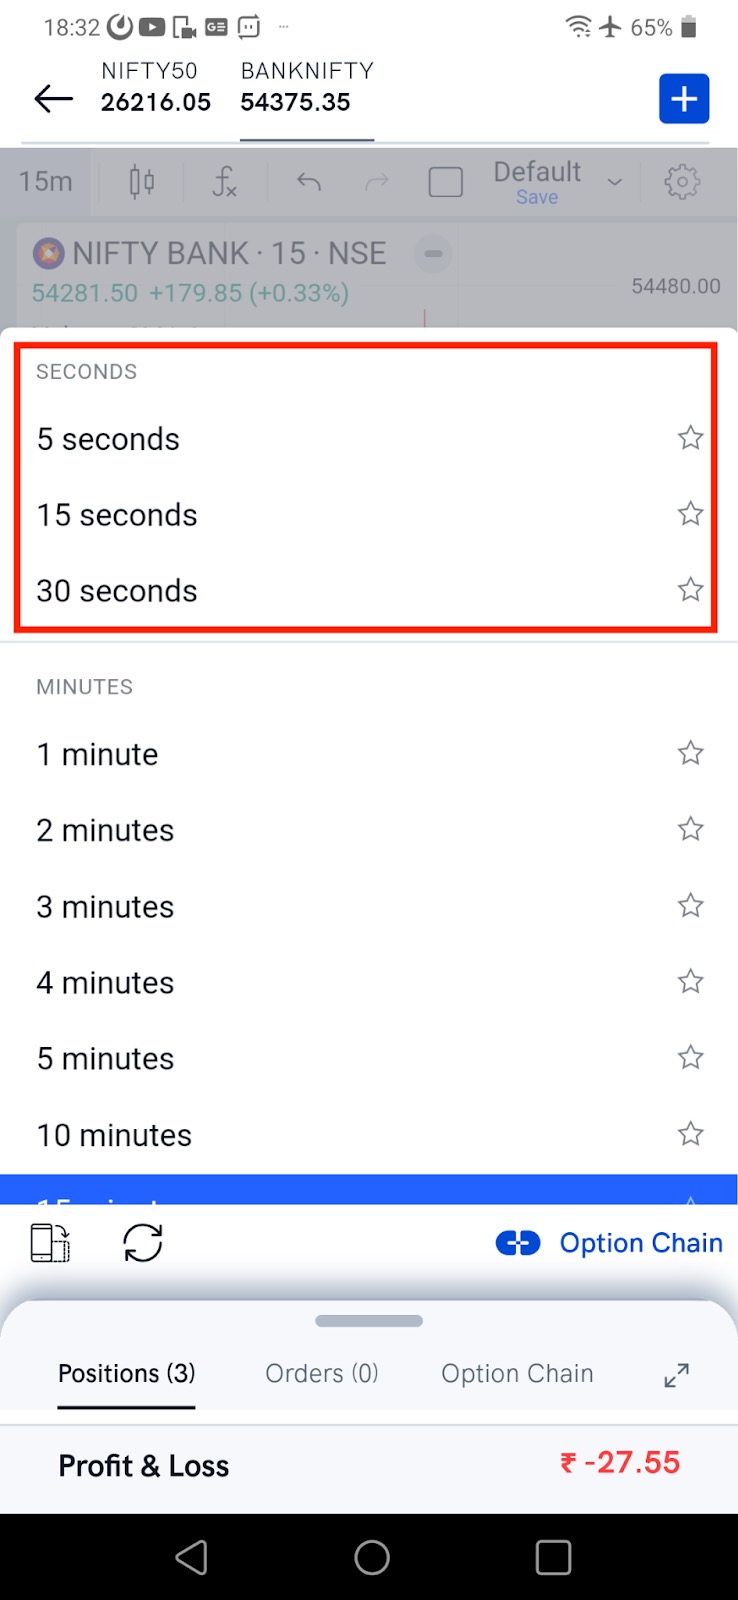
You can also enable time intervals in seconds. Simply tap the "Time Interval" button and select the desired interval in seconds from the options provided.
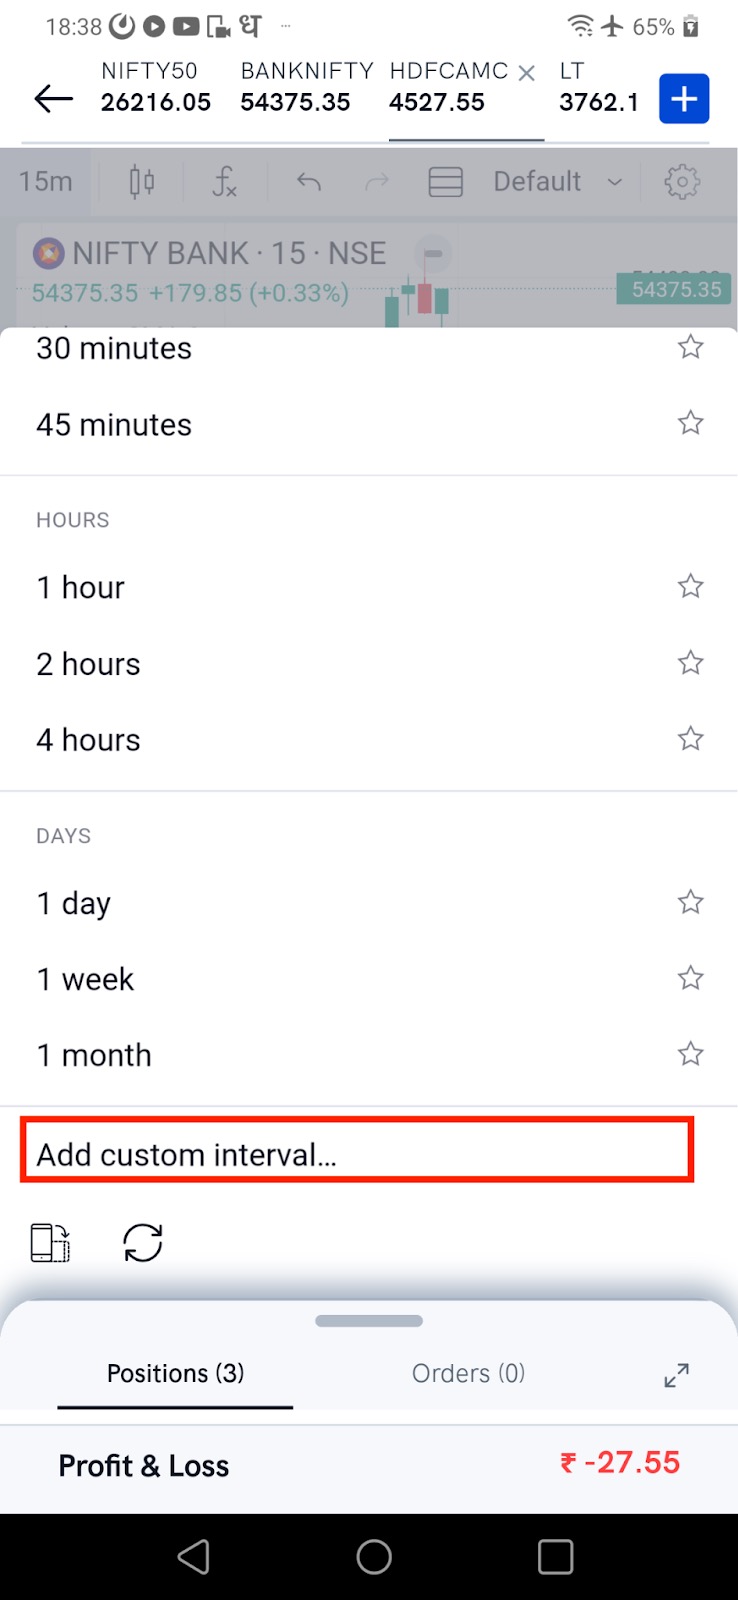
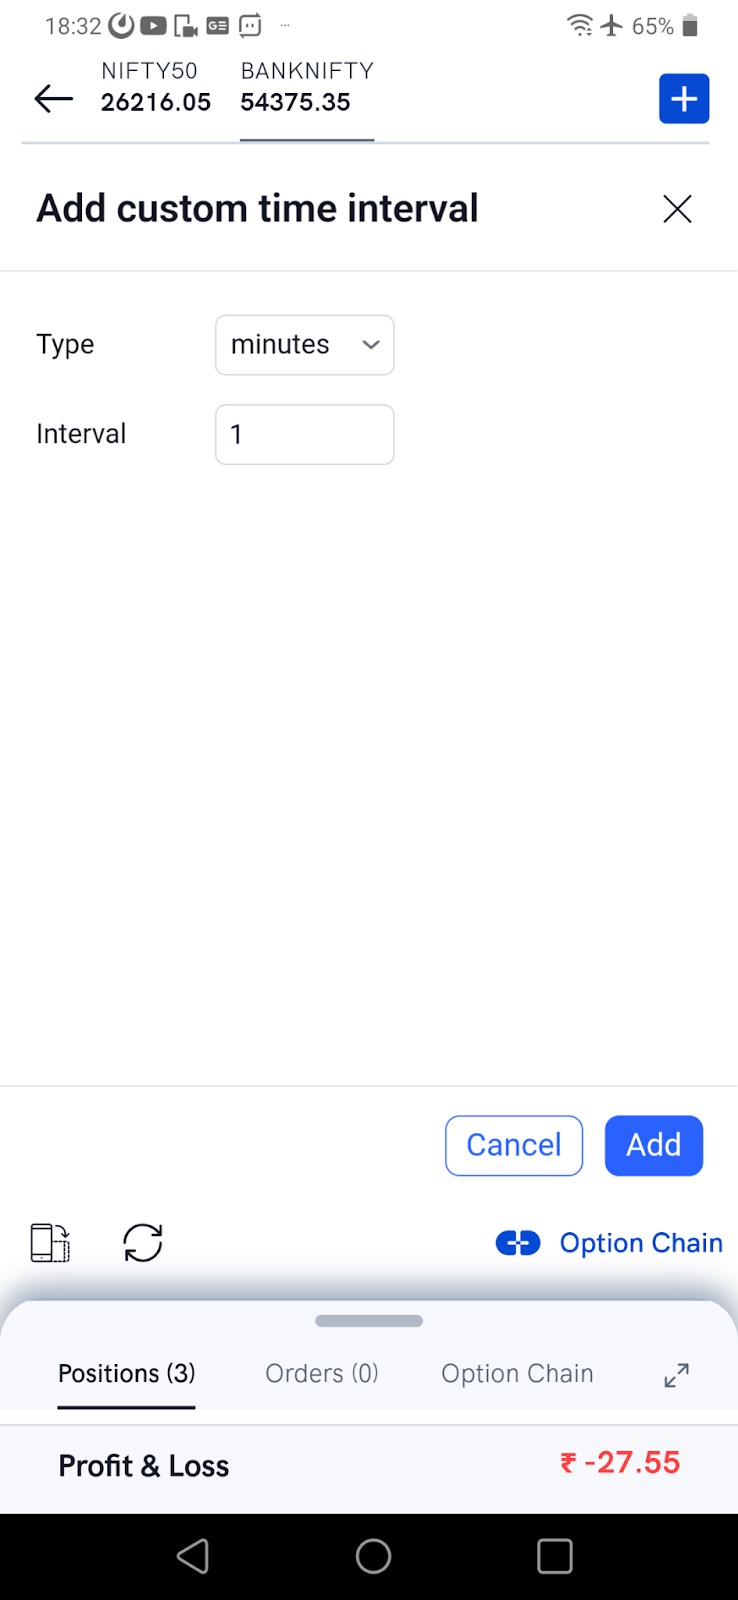
You can also create and apply a custom interval to suit your preferences.
-
To do this:
Tap the "Interval" button and scroll down to select the "Add Custom Interval" option
-
Enter your desired interval, and it will be added to the list of available intervals
-
You can then apply it to the chart by simply tapping on it.
Note: The chart layout is automatically saved after 60 seconds of viewing or can be manually saved by tapping the "Save" button at the top of the chart screen.